A Decision Matrix for the Built Environment
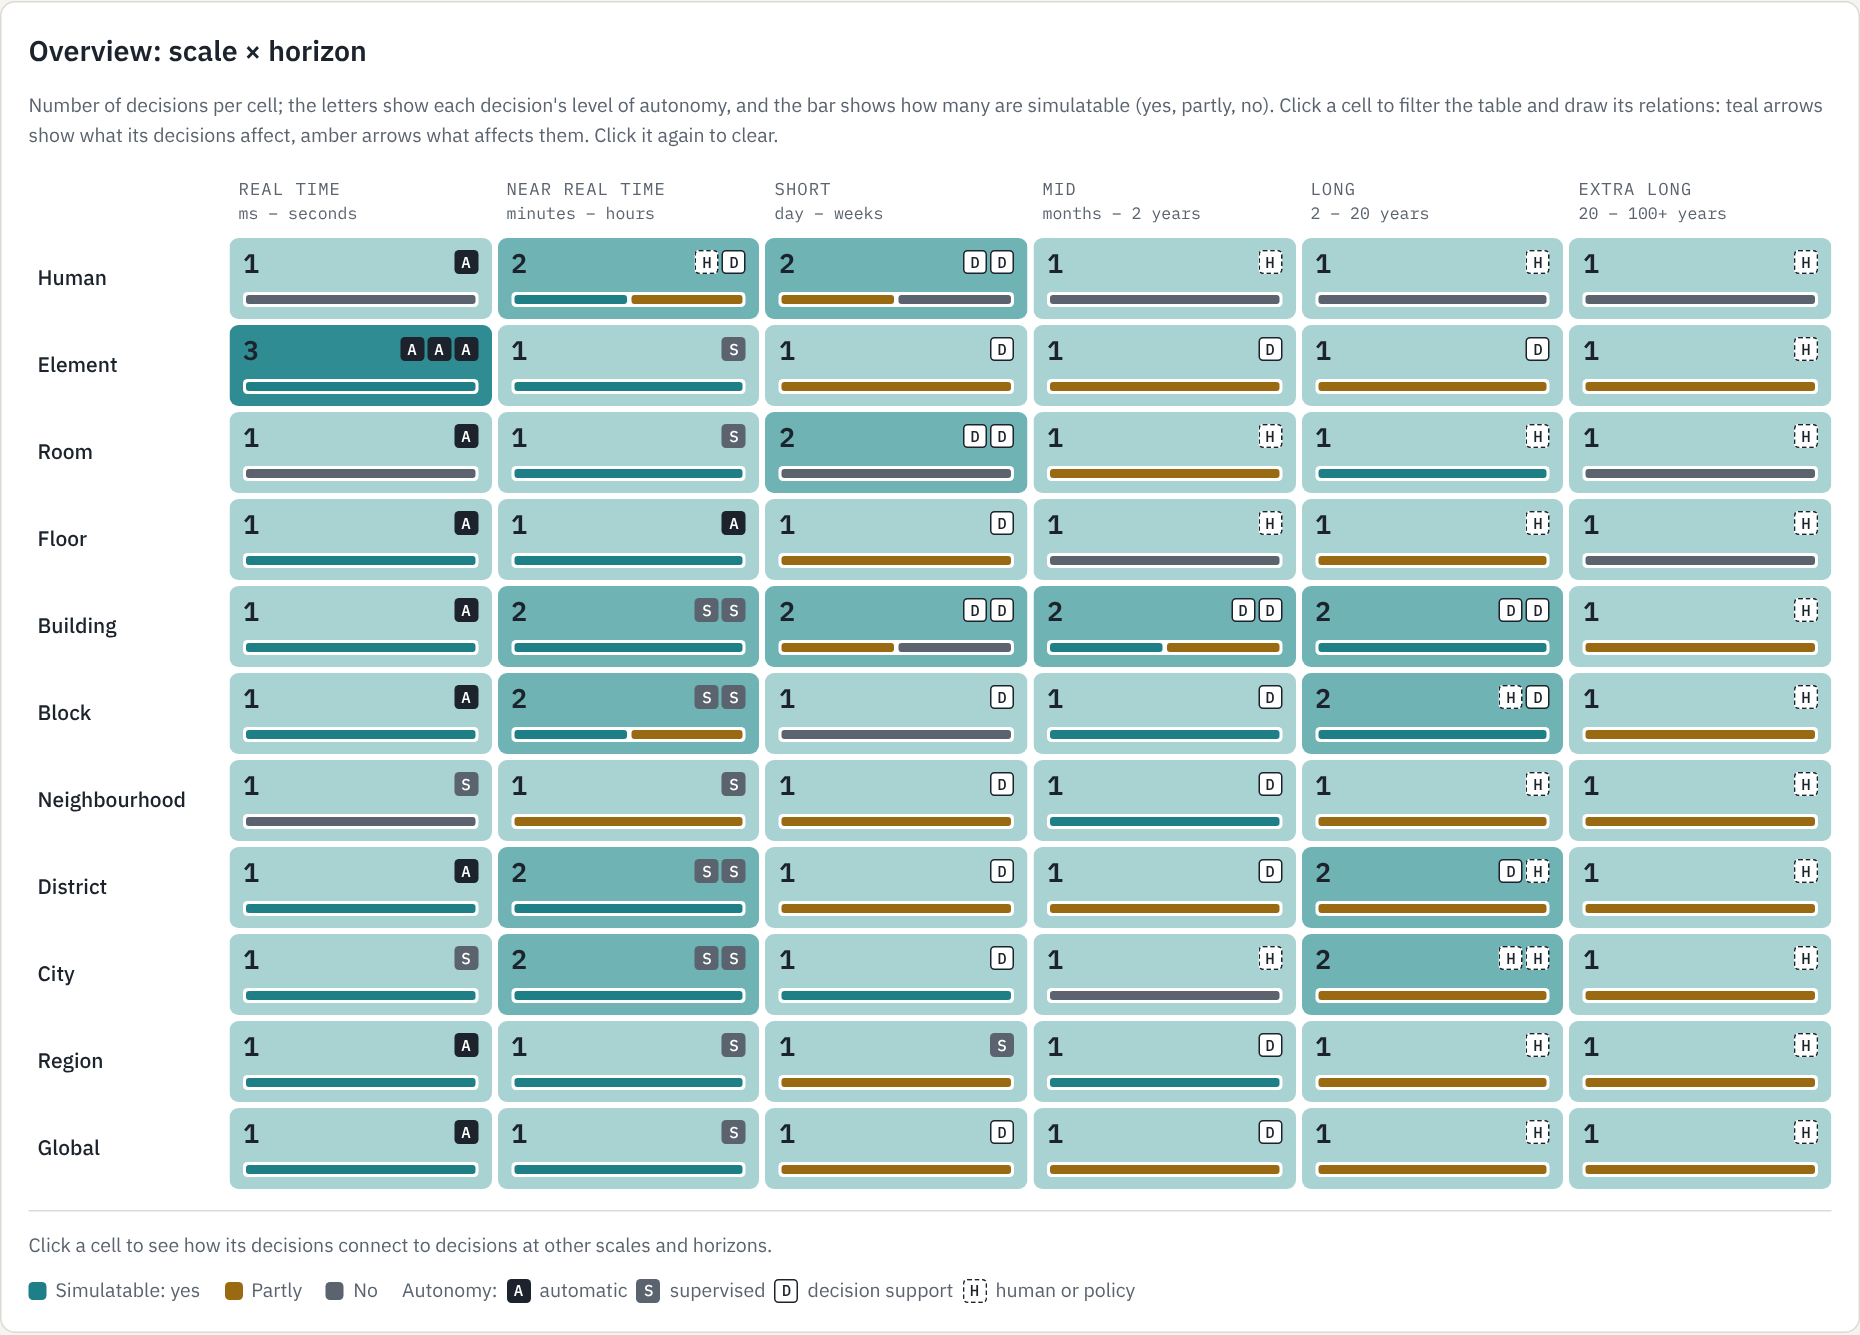
What is a digital twin for? The usual answer is a list of features: 3D models, sensors, dashboards. I wanted a better answer, so I worked backwards. Start from the decision someone has to make, ask what would have to be predicted to make it well, and only then ask what to simulate and which data to collect.
That turned into a matrix. It is a first draft, and I am sharing it because I think the shape of it says more than any single row.
Open the interactive matrix in a new tab →
Two axes
Spatial scale, in eleven steps from the human scale to the global scale: human, element (a chiller, a valve, a façade panel), room, floor, building, block, neighbourhood or campus, district, city, region and global.
Time horizon, in six steps:
| Horizon | Time scale | Typical decision-maker |
|---|---|---|
| Real time | milliseconds to seconds | controllers |
| Near real time | minutes to hours | building systems, operators |
| Short term | a day to weeks | facility managers |
| Mid term | months to about 2 years | owners, managers |
| Long term | about 2 to 20 years | owners, planners |
| Extra long term | 20 to 100+ years | the city and society |
Each of the 81 decisions also records its domain (energy, comfort and health, mobility, water, safety, land use, economy and operations), who decides, how much can be automated, what a world model would have to predict, the inputs and models involved, the data model it needs, and what real measurement could check the prediction. Thirty-five couplings record how decisions feed or constrain each other across scales: room loads add up to a building load, a new infill building can shade a neighbour’s roof, household location choices add up to city growth.
Can it be simulated?
Every decision carries one flag that I found the most revealing:
- Yes: the quantity to predict follows from physics or engineering (heat, light, airflow, traffic, hydraulics) with available data. 33 decisions.
- Partly: part of the outcome can be simulated, but the result hinges on behaviour, markets or occupancy that must be assumed or learned. 33 decisions.
- No: driven mainly by preference, organisation, politics or markets. You learn from data or you work with scenarios. 15 decisions.
The pattern across horizons is stark. Of the 29 real-time and near-real-time decisions, 23 are fully simulatable. Of the 11 extra-long-term decisions, none are. Physics dominates the fast loops; people dominate the slow ones.
What the matrix shows
Most decisions sit near the diagonal. Small things are decided fast, large things slowly. The interesting cells are off the diagonal: a city that must act within seconds (emergency dispatch, flood alerts), and a household making a decision that lasts decades (where to live).
Autonomy follows the same diagonal. Controllers act alone in the top-left corner. In the middle, AI recommends and a person decides. In the bottom-right, decisions belong to policy and governance. Reinforcement learning, for instance, fits naturally in the near-real-time row, where a building’s systems can act on their own and a simulator exists to learn in. Most of the matrix is decision support, not autonomy.
What each decision depends on shifts too. Fast decisions depend mostly on sensors: the live state of a room or a network. Slow decisions depend mostly on form, context and scenarios. That is why I think a semantic city model such as CityGML matters more as the horizon gets longer, from the building row down to the city, and from the mid term out to the extra long term. For the human and room rows, indoor models (BIM, or CityGML LoD4) and sensors matter more.
No single world model serves all of it. A twin that tries to answer every row with one model will answer none of them well. Robotics deals with the same problem through hierarchical control, with fast reflexes nested inside slower planning. A useful city twin probably needs the same layering.
Caveats
This is a working draft, not a survey. The 81 decisions are examples chosen to cover every cell, not a complete list. The simulatable flag is a judgement call, and several rows could reasonably move between yes and partly. The tools named in the table are examples of each kind, not recommendations. If you think a row is in the wrong place, or a whole class of decisions is missing, I would like to hear it.
The matrix was drafted with Claude (Anthropic) in a working session. I set the frame, the time horizons, the scales and the simulatable flag; Claude proposed the rows, the attributes and the couplings.
The interactive version
Filter by scale, horizon, domain, autonomy or simulatability. Click a cell to narrow the table and draw its relations across the matrix (teal arrows: what its decisions affect; amber: what affects them). Click a row for its details.
Open the matrix in a new tab ↗
If you are interested in the concepts behind the columns, two one-page cheat sheets cover them: World Models and Benchmarking.