I Gave It the Dimensions of a Room. It Gave Me a Daylight Study.
Let me be direct about what this post is, because the disclosure is the point rather than a caveat at the bottom.
Everything below — the method, the Radiance setup, the 64 variants, the annual metrics, the glare analysis, the validation suite, every figure, and the report they came from — was produced by an AI model. I supplied a short list of facts about a room. I did not write the simulation scripts, choose the sky model, set the ambient bounce count, decide to rank by median instead of mean, or draw a single chart. I read the output, asked questions, and confirmed a few things about the building when asked.
The daylight result is genuinely interesting, and I’ll go through it properly, because a claim like the one I just made is worthless unless you can see the work. But the daylight result is the evidence. What I actually want to talk about is what it means that this artefact exists at all, and what it still could not do.
So before anything else, here is the thing itself, unedited:
Download the full 22-page report (PDF, 1.6 MB) →
I have not rewritten it, trimmed its hedges, or cleaned up the sections where it contradicts its earlier self. What is below is my reading of it; that file is what it actually produced. If you work in this field, I would rather you judged the artefact than took my summary of it — and if you find something wrong in there, I would genuinely like to know, because that is the check nobody has run yet.
Here is literally everything I gave it
This is the complete list. It is recorded in the study’s own assumptions.md, which separates what I supplied from what it derived — a separation I did not ask for.
| what I provided | value |
|---|---|
| Plan | six vertices traced counter-clockwise from the SW corner; wall lengths 690, 692, 375, 392, 315, 300 cm |
| Area | 35.40 m² |
| Ceiling height | 300 cm |
| Orientation | true north is 15° clockwise of the plan’s “up” direction |
| Which walls are which | W0, W1, W2 have rooms behind them; W3 and W4 are internal partitions; W5 is the only exterior wall |
| Window | on W5, 150 × 150 cm, sill at 100 cm, flush against W4 |
| Shutter and mesh | an insect mesh and a shutter; open aperture effectively ≈ 100 cm |
| Balcony door | solid timber, no glazing |
| The block opposite | 5 storeys, about 5 m away, beige, blank — no openings |
| Our building | 5 storeys; the room is on the 4th, one occupied floor above |
| Location | New Damietta |
| Work plane | 80 cm |
That is it. A dozen lines, the kind of thing you could dictate over the phone while standing in the room.
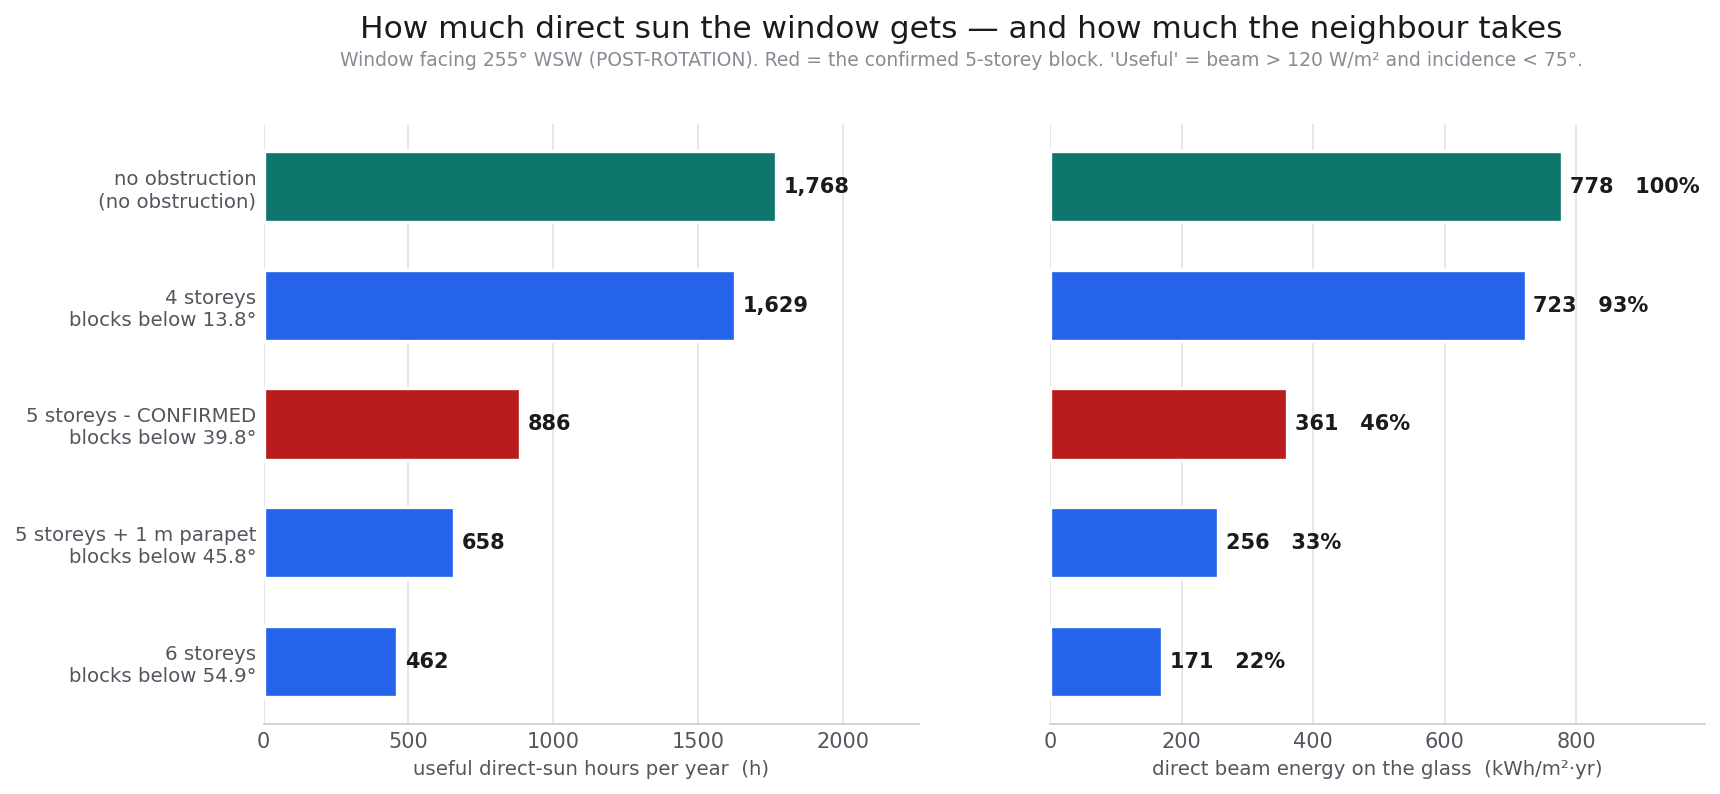
Everything else came from the model. It selected the weather file — the TMYx record for Damietta, WMO 623300 — and rewrote its header to the site coordinates it looked up from the place name. It worked out that “five storeys, we’re on the fourth with one above” is only self-consistent if the ground floor counts as storey 1, assumed 3.00 m per storey, and derived that the room floor sits 9 m above the street and both roofs at +6 m relative to it. From that it computed the number that governs the entire room: the block opposite hides the first 39.8° of sky above the horizon, leaving 50.2° of the sky dome visible from the window centre.
It chose every reflectance value in the model and said which was a measurement convention and which was a guess. It decided the insect mesh should be a lumped transmittance of 0.60 rather than modelled wire geometry — and then flagged that this gets the quantity of light right but not the effect on contrast or the softening of a sun patch edge, and that full fidelity would need a measured BSDF. It assumed an RC frame and derived a 2.60 × 2.60 m structural ceiling on any enlarged opening. It decided which 64 variants were worth building.
It also caught a conflict in what I gave it. I had said the window sits 100 cm from the south end of W5, and later that it is flush against W4. Those differ by 50 cm. It adopted the second, on the reasoning that flush-to-a-partition describes something I can see rather than a remembered offset — then simulated both anyway, and reported that window position on that wall is one of the weakest parameters in the room, so the ambiguity costs almost nothing.
I want to sit with that last one for a moment, because it is not the same kind of thing as writing code. Noticing that two of my statements are inconsistent, picking the more reliable one for a stated reason about how human memory fails, hedging by running both, and then quantifying how much the disagreement actually matters — that is a research posture, not an execution step.
What the room is
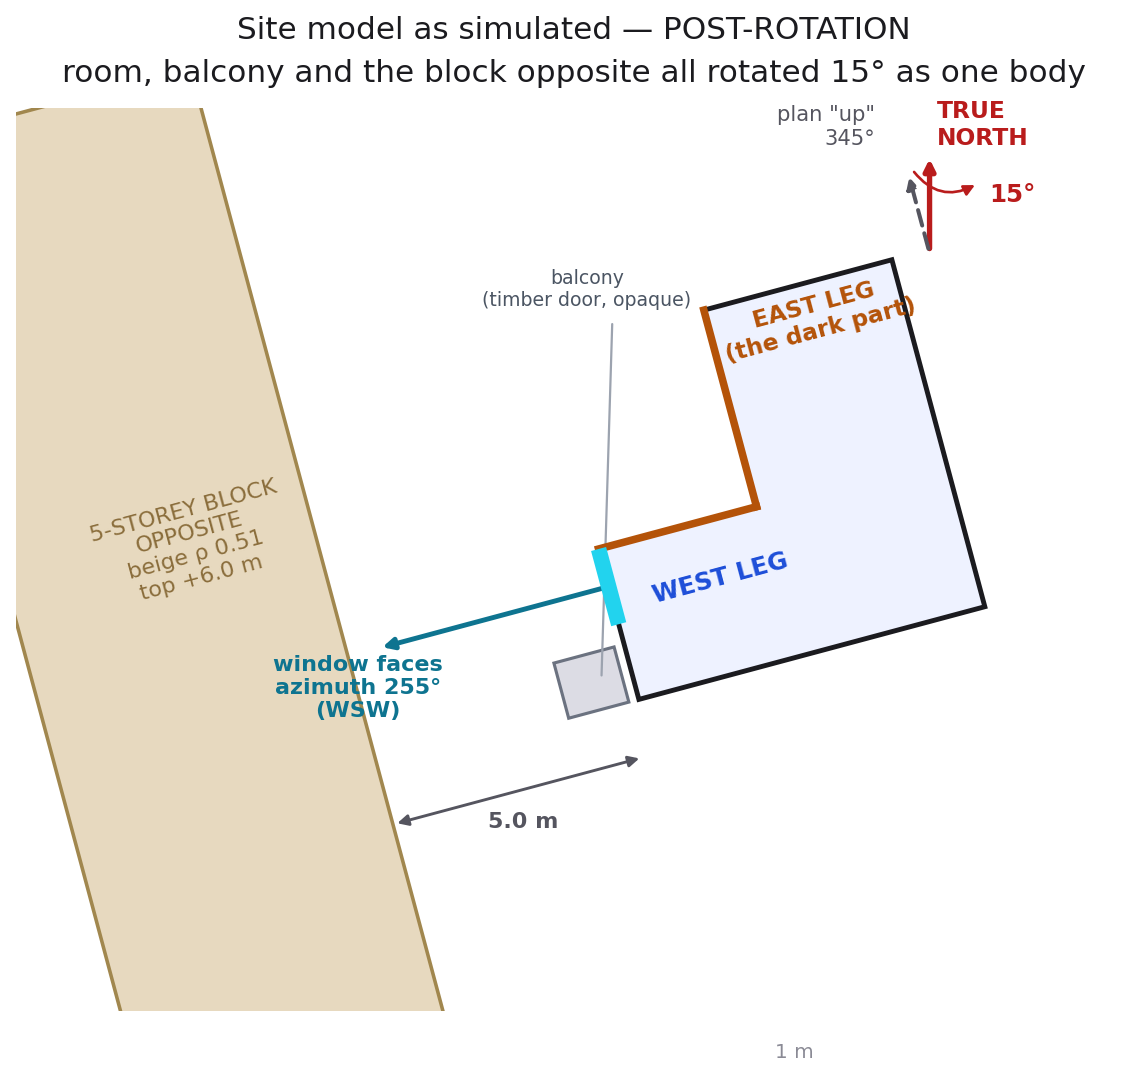
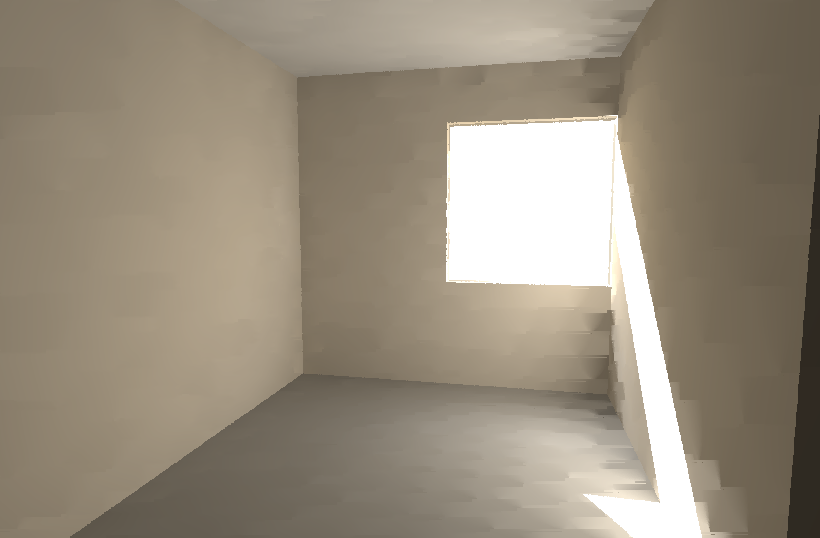
The room has exactly one exterior wall. Three metres of it, facing 255° — west-south-west — with a blank five-storey block standing five metres away. Part of those three metres is a solid timber balcony door, so the actual aperture is one 150 × 150 cm window.
Because the block opposite eats the bottom 39.8° of sky, most of the light reaching the work plane has bounced three or more times. For the east leg of the L, which has no line of sight to the window at all, effectively all of its light has bounced several times. That single fact explains every result that follows, and the model identified it as the governing constraint before running anything.
The method it chose
Radiance 6.0.2. 852 sensors on an 80 cm work plane at 20 cm spacing. 64 variants, 292 point-in-time illuminance fields, ten annual runs by the daylight-coefficient method, 54 glare evaluations.
Two settings are worth calling out, because they are the kind of thing that separates someone who knows the tool from someone who has read the manual:
-ab 12, not the usual-ab 5. It ran a convergence sweep first — the mean moved +1.8% from-ab 7to-ab 9, +0.7% to-ab 12, +0.1% to-ab 15— and reasoned that a room dominated by high-order interreflection needs the extra bounces, where a room with a big unobstructed window would not. That is the correct call, and it is correct for this room specifically.- Ambient caching off (
-aa 0), so no interpolation artefacts smear across the sensor grid.
And it validated before it trusted anything:
| check | expected | measured |
|---|---|---|
| Sky luminous efficacy, 14 daylit skies | 105–115 lm/W | 104.8 – 111.0 |
| CIE overcast horizontal illuminance | 10 000 lx | 9 984 lx (−0.16%) |
| Total-solar sky, unobstructed horizontal plane | EPW GHI = 2 032 kWh/m²·yr | 1 982 (97.5%) |
Solar position vs gensky, six seasonal points |
agreement | within 0.6° altitude, 1.5° azimuth |
Nobody asked for that table. It is the difference between output and a result.
The room as it stands
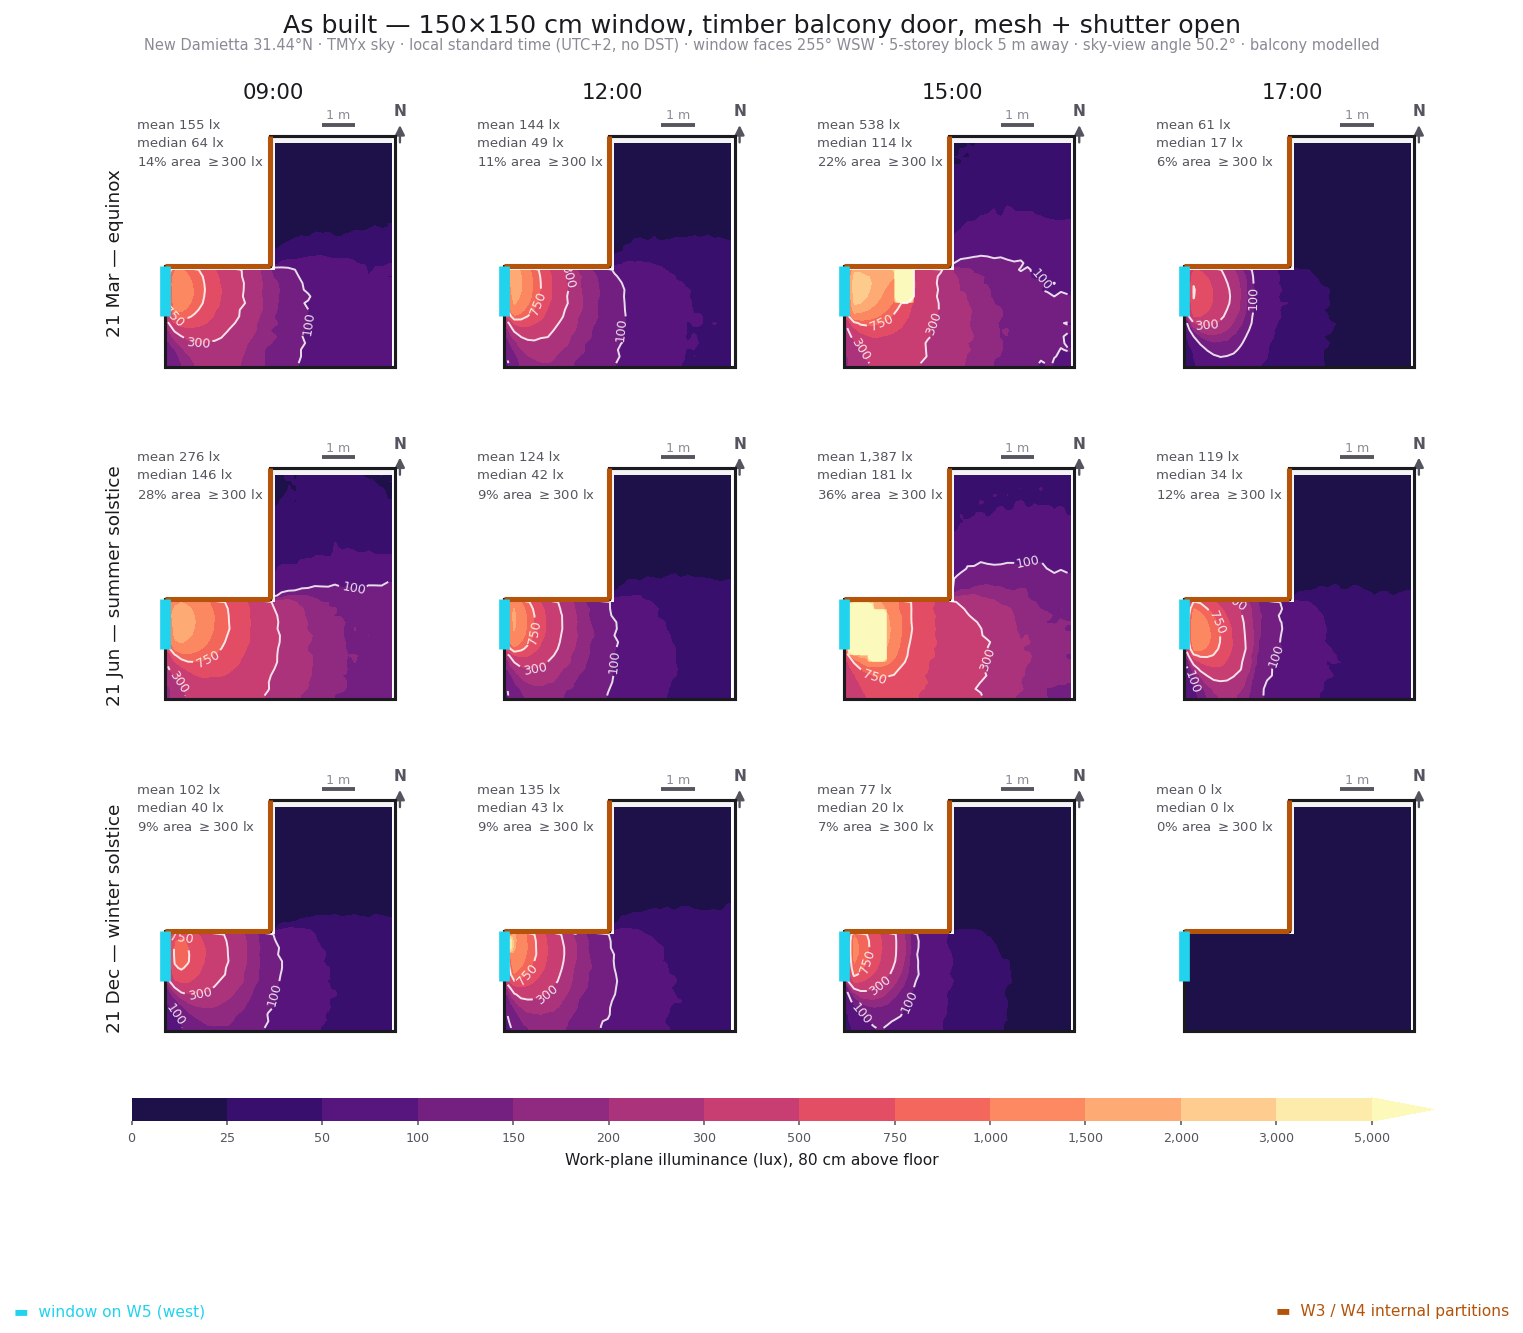
At the March equinox the room means 155 lx at 09:00 and 538 lx at 15:00. In December at 17:00 it means zero.
Reading the two charts that convinced me
I want to spend real time on two figures, partly because they carry the argument and partly because neither is readable cold — and the fact that I had to be taught to read output I nominally commissioned is itself part of what this post is about.
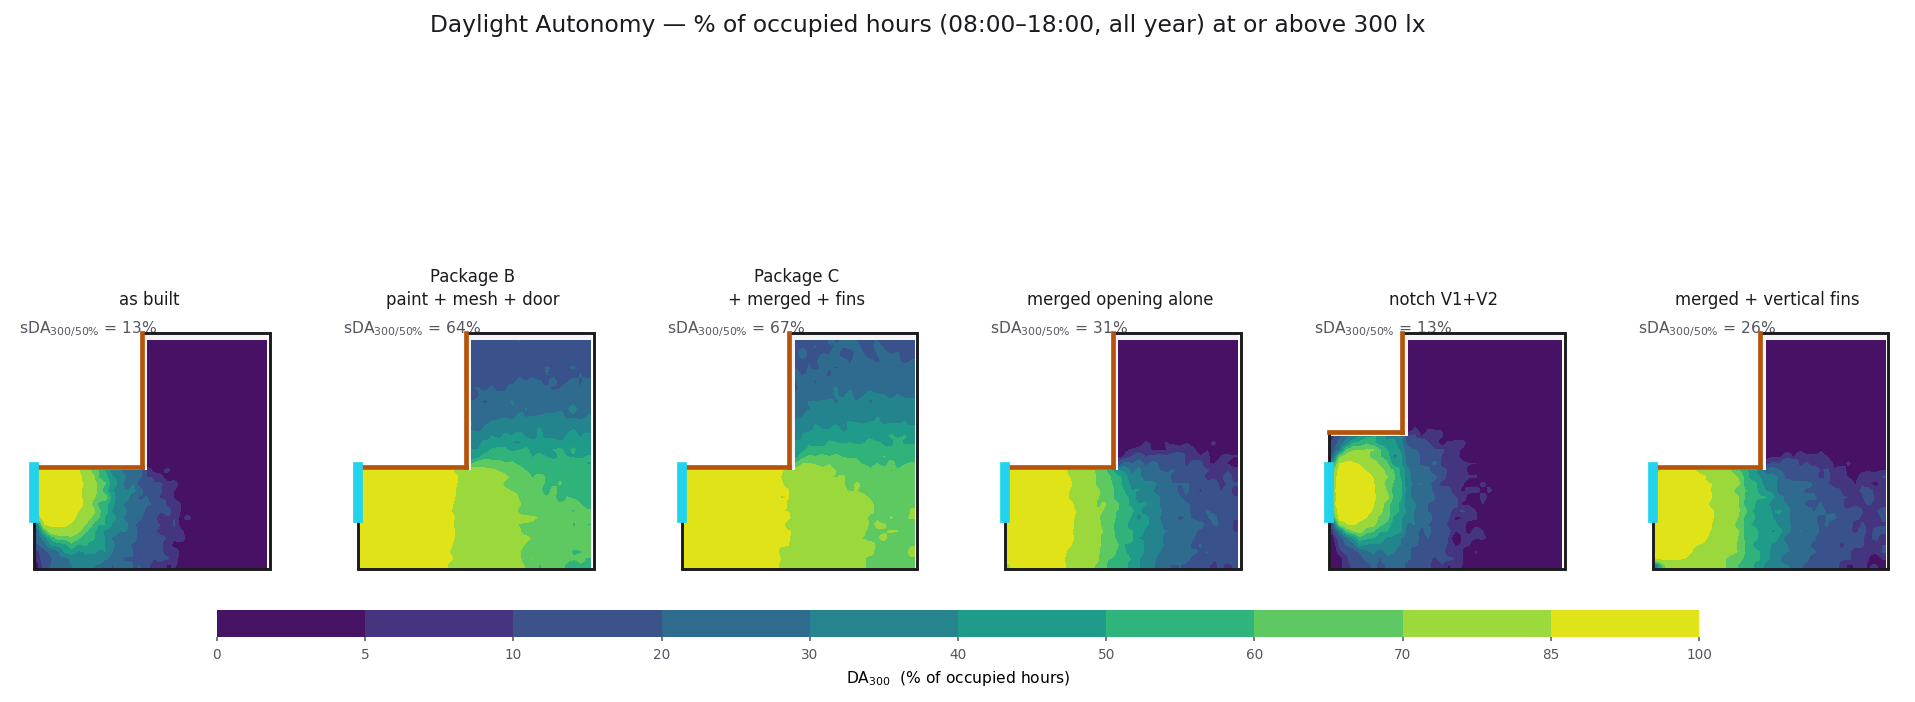
Daylight autonomy
Take every sensor on the grid. Step through all 3650 occupied hours of the year (08:00–18:00). Count the fraction of those hours in which that point sits at or above 300 lux — enough for reading or desk work. A point that clears it 85% of the year plots yellow; one that clears it 5% plots near-black. The headline number, sDA₃₀₀/₅₀%, is the spatial summary: the percentage of floor that clears 300 lx for at least half the occupied hours.
As built: 13%. A small yellow pool inside the window, and the entire east leg flat dark. Package B — paint, an open-weave screen, a glazed balcony door — reads 64%. Package C, adding a merged structural opening and fins, reads 67%.
The panel I keep returning to is the fifth, “notch V1+V2”: the partition move on its own. 13%. Identical to as built. Moving structure, by itself, buys nothing here.
Useful Daylight Illuminance
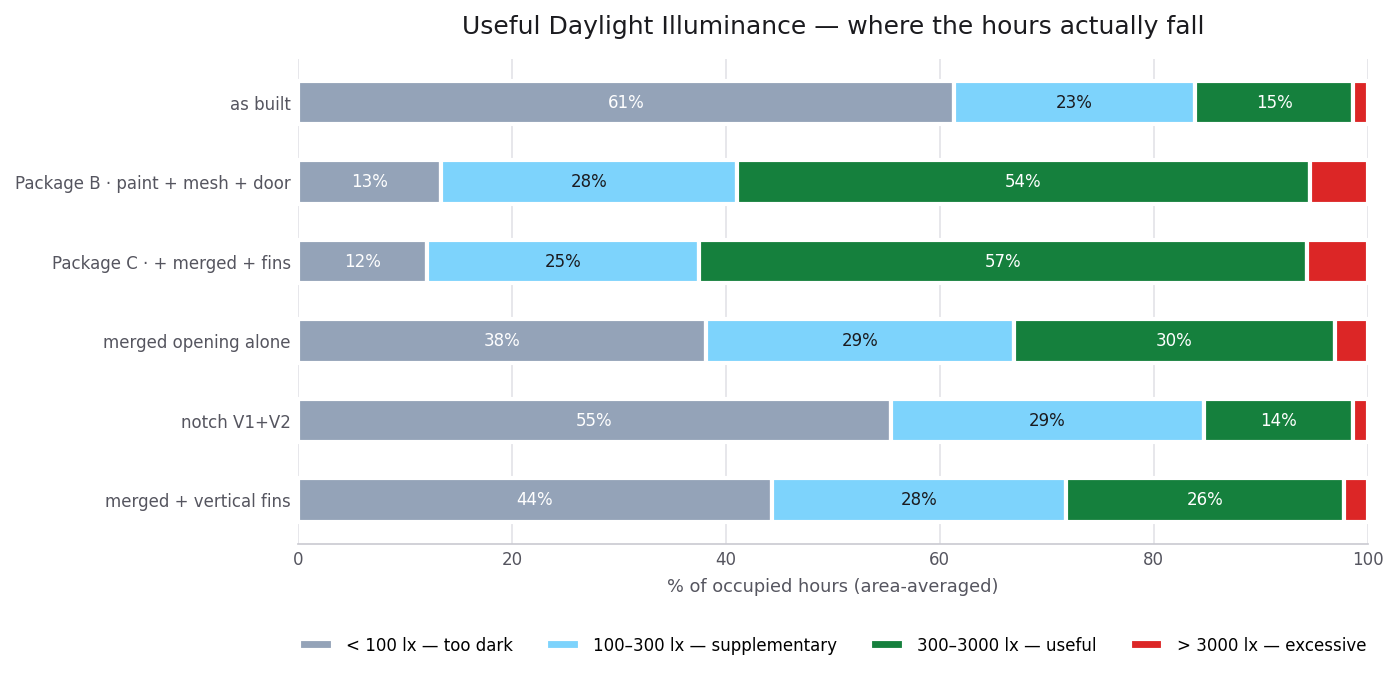
Daylight autonomy asks one question — is it bright enough? — and answers yes or no. Useful in a temperate climate. Less useful here, because it throws away a distinction that matters enormously in Egypt: a room can fail by being too dark or too bright, and an autonomy map scores an eye-watering 8000 lux as a success in exactly the same way it scores a comfortable 400.
UDI fixes that by sorting every occupied hour into bands instead of passing or failing it. Each bar is 100% of the occupied hours for one case, area-averaged over the room, cut four ways:
- Grey, below 100 lx — too dark. You would switch a lamp on. Nothing useful is happening.
- Blue, 100–300 lx — supplementary. Enough to move around in, not enough for sustained visual work.
- Green, 300–3000 lx — useful. The band you actually want. Read this one first.
- Red, above 3000 lx — excessive. Not a bonus. Direct sun on the work plane: veiling reflections, contrast the eye cannot accommodate, heat.
So: how far left does the grey reach, how much green is there — and then, as a check, has any of it spilled into red?
As built the answer is grim in a specific way. Grey runs to 61% — dark for three fifths of the working day — with only 15% of hours useful. There is essentially no red, which sounds like good news and is not: the room is not over-lit because it is barely lit at all.
Package B inverts it. Grey collapses 61% → 13%; useful goes 15% → 54%. Paint, a screen, a door.
But look at the right end of the improved bars. A thin red sliver appears — 5–6% of hours now exceed 3000 lux. That is the afternoon sun patch. UDI is the only chart here that shows both failure modes at once, and it is why I trust it more than the headline. The improved room is not simply “better” — it has traded a large under-lighting problem for a small over-lighting one, and the second one needs a blind.
One more thing the chart quietly settles: compare “merged opening alone” (38% grey) with Package B (13% grey). The merged opening is demolition, a lintel and a new frame. Package B is a weekend and some paint. The bigger hole in the wall loses.
What actually moves the answer
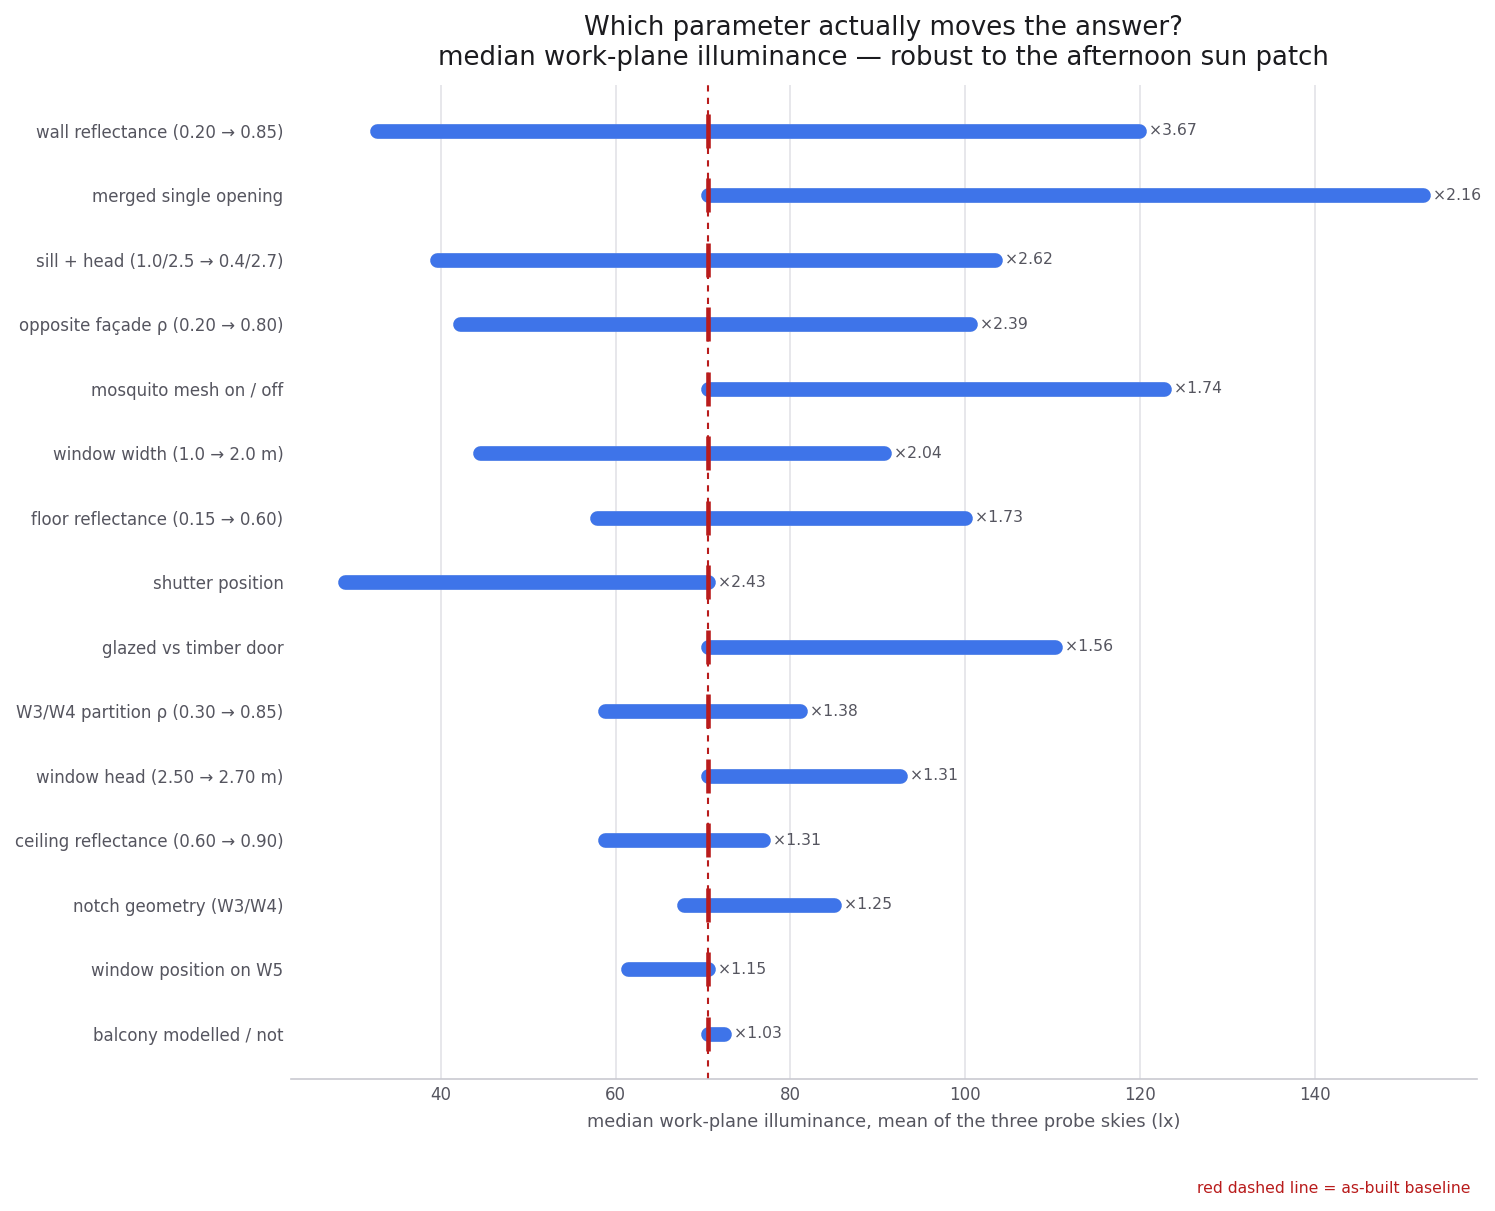
A tornado chart, and the ×-factors are easy to misread, so: each row is one parameter swept across its whole plausible range while everything else is held at its as-built value. The bar spans worst setting to best. The red line is the room today, so a bar extending right has upside and a bar extending left is room you could still lose. The ×-factor is the ratio of the best end to the worst end — total leverage, not the improvement you would get by changing it.
Two traps in that definition, both of which caught me:
- A large × does not mean a large gain is available to you. “Shutter position” spans ×2.43, but nearly all of that bar sits left of the baseline — the shutter is already almost open, so the range mostly describes light you could lose, not gain.
- The bars are not additive. Each is measured in isolation.
With that framing the ranking is unambiguous. Wall reflectance, ρ 0.20 → 0.85, spans ×3.67 — more than any geometric move available, including the largest opening the structure permits (×2.16). Window position along W5, which I would have guessed mattered most, spans ×1.15 and is noise.
The reason is the bounce count. If light arrives after three reflections it carries a ρ³ term, and moving ρ from 0.20 to 0.85 takes ρ³ from 0.008 to 0.61 — a factor of 76. Nothing you can do to a three-metre wall buys leverage of that order.
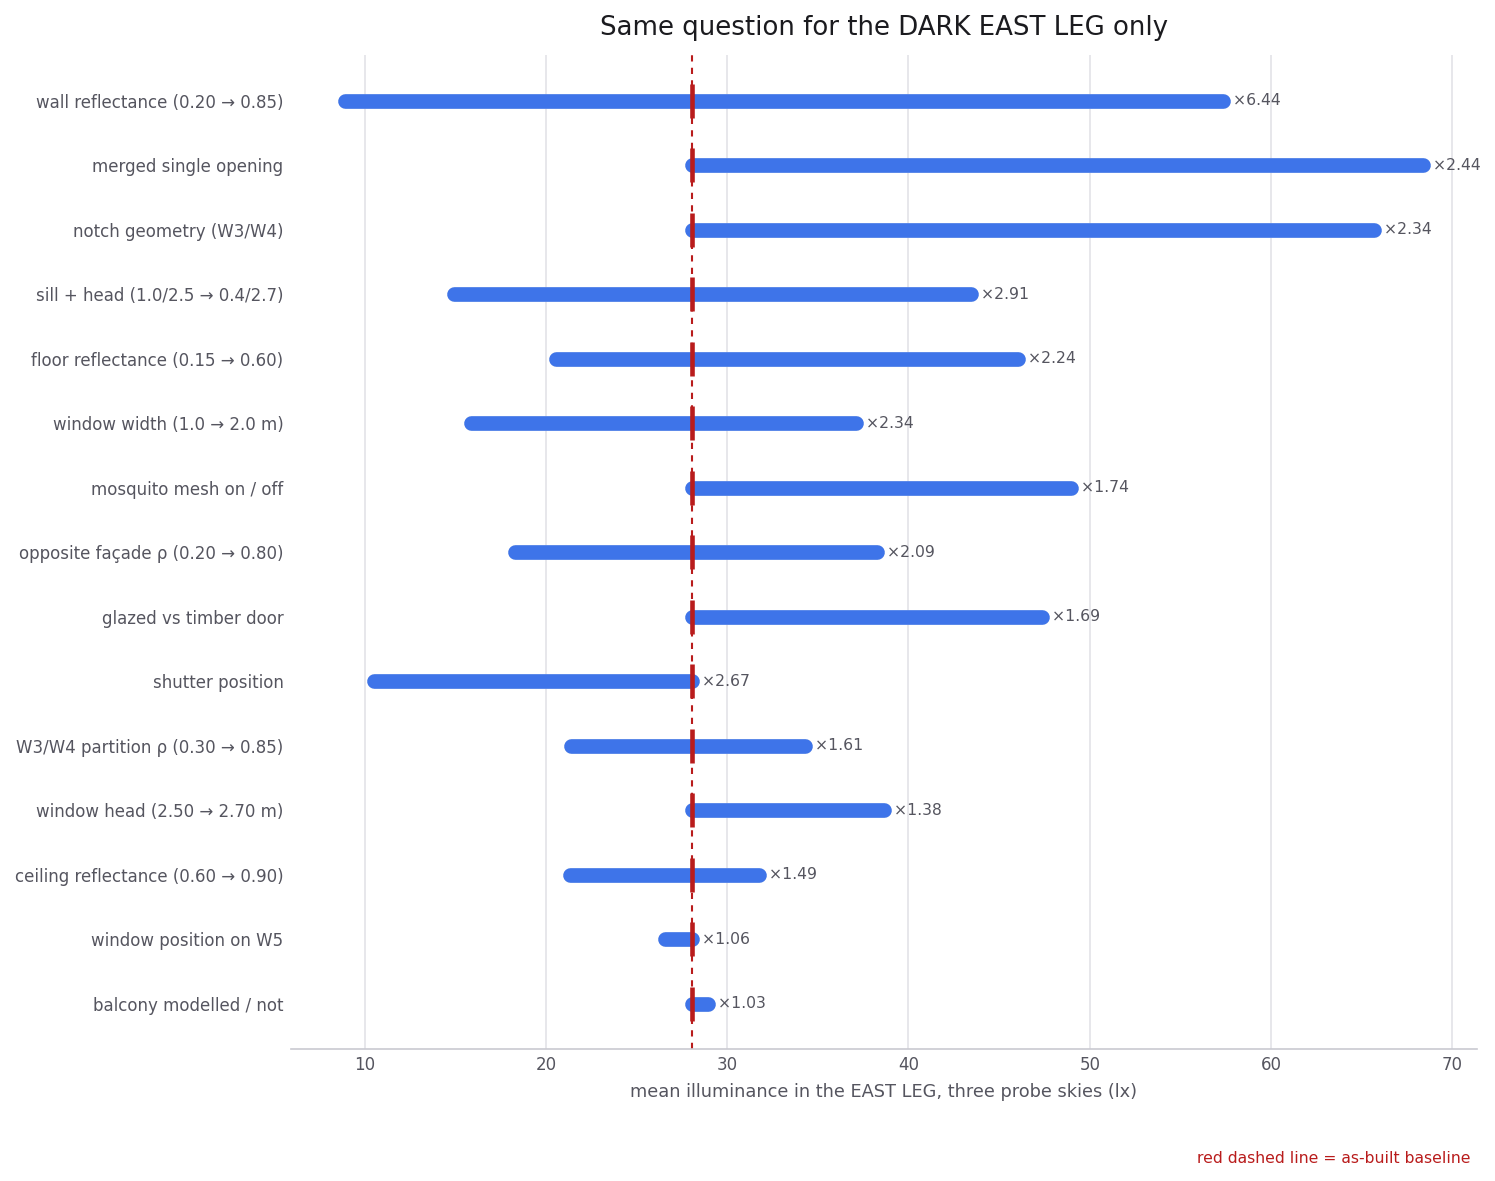
That is the ρ³ argument made visible. Whole room: ×3.67. The corner light reaches after the most bounces: ×6.44. Notch geometry also climbs (×1.25 → ×2.34), for the obvious reason that the notch is what stands between the window and that corner.
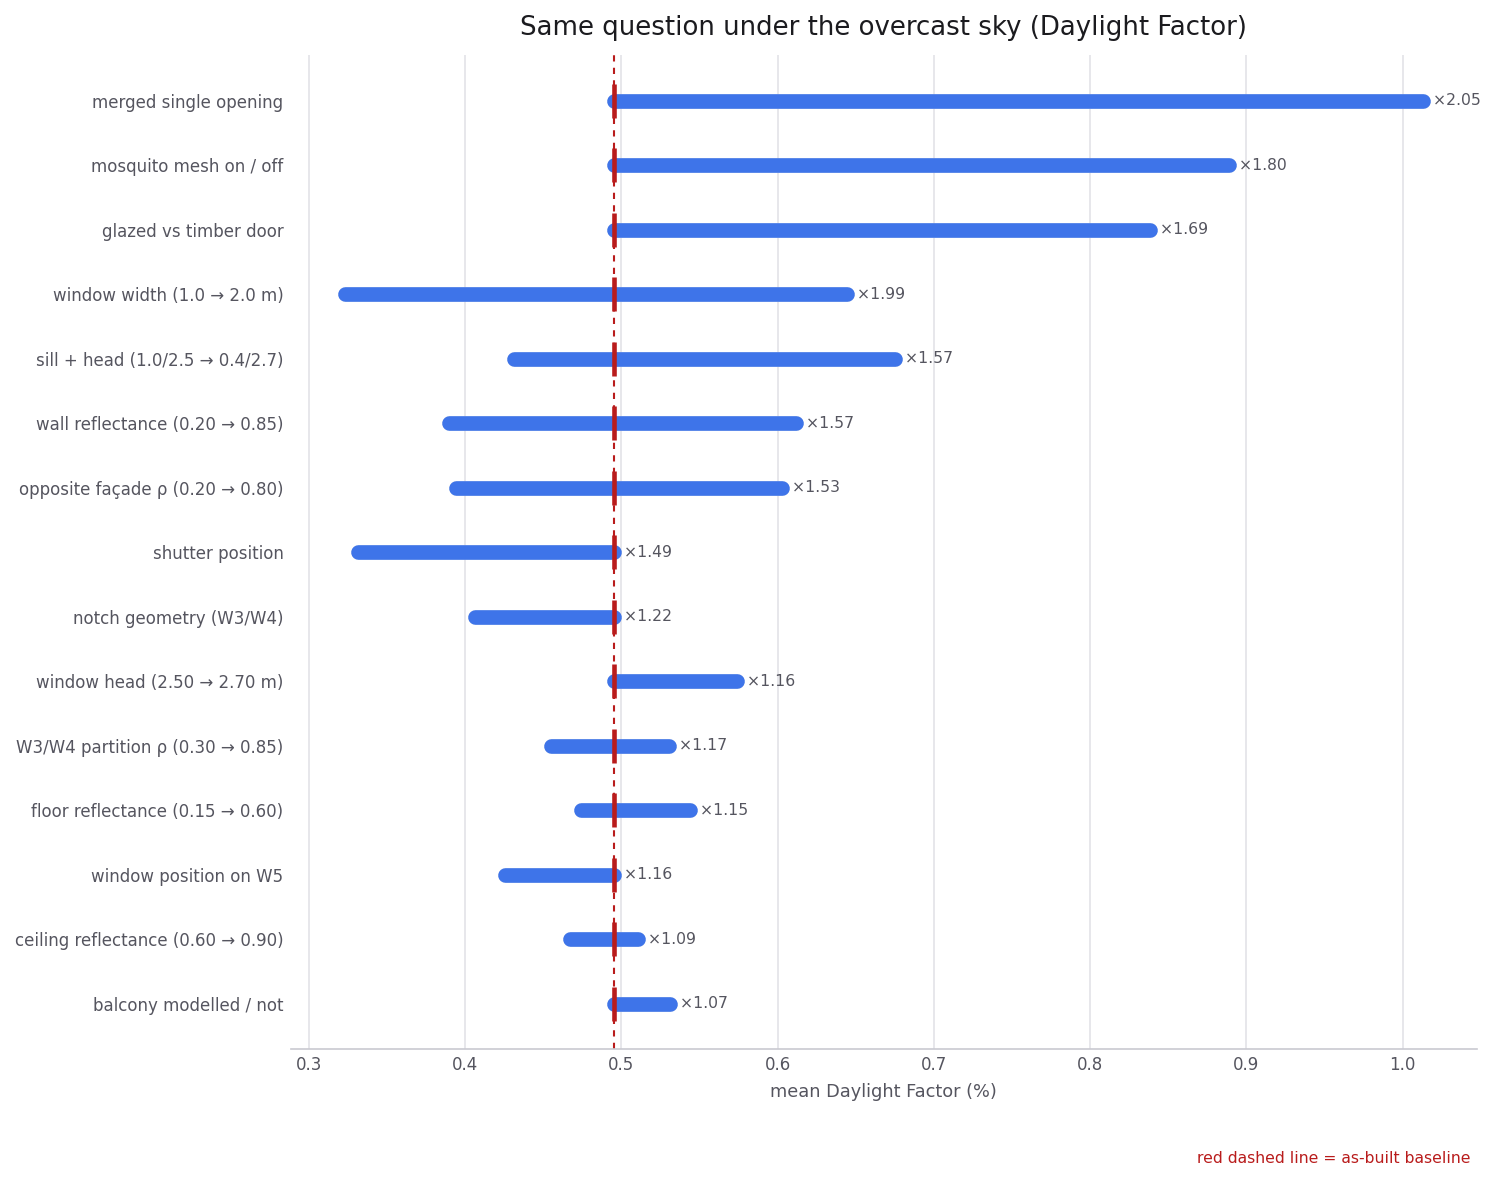
I am including this one because the model included it, and because it is a corrective against exactly the over-generalisation the post could otherwise invite. Daylight Factor is measured under a uniform overcast sky with no sun in it. Remove the direct beam and the room is no longer living on a few very bright bounces off a sunlit façade — it is living on a modest diffuse supply where the binding constraint is simply how much gets in through the hole. So aperture leads, mesh comes second, reflectance drops to sixth.
Both charts are right. They answer different questions. “Reflectance beats geometry” is a claim about this room, in this climate, under skies containing sun. It is not a law of daylighting, and the model said so before I could.
The interventions
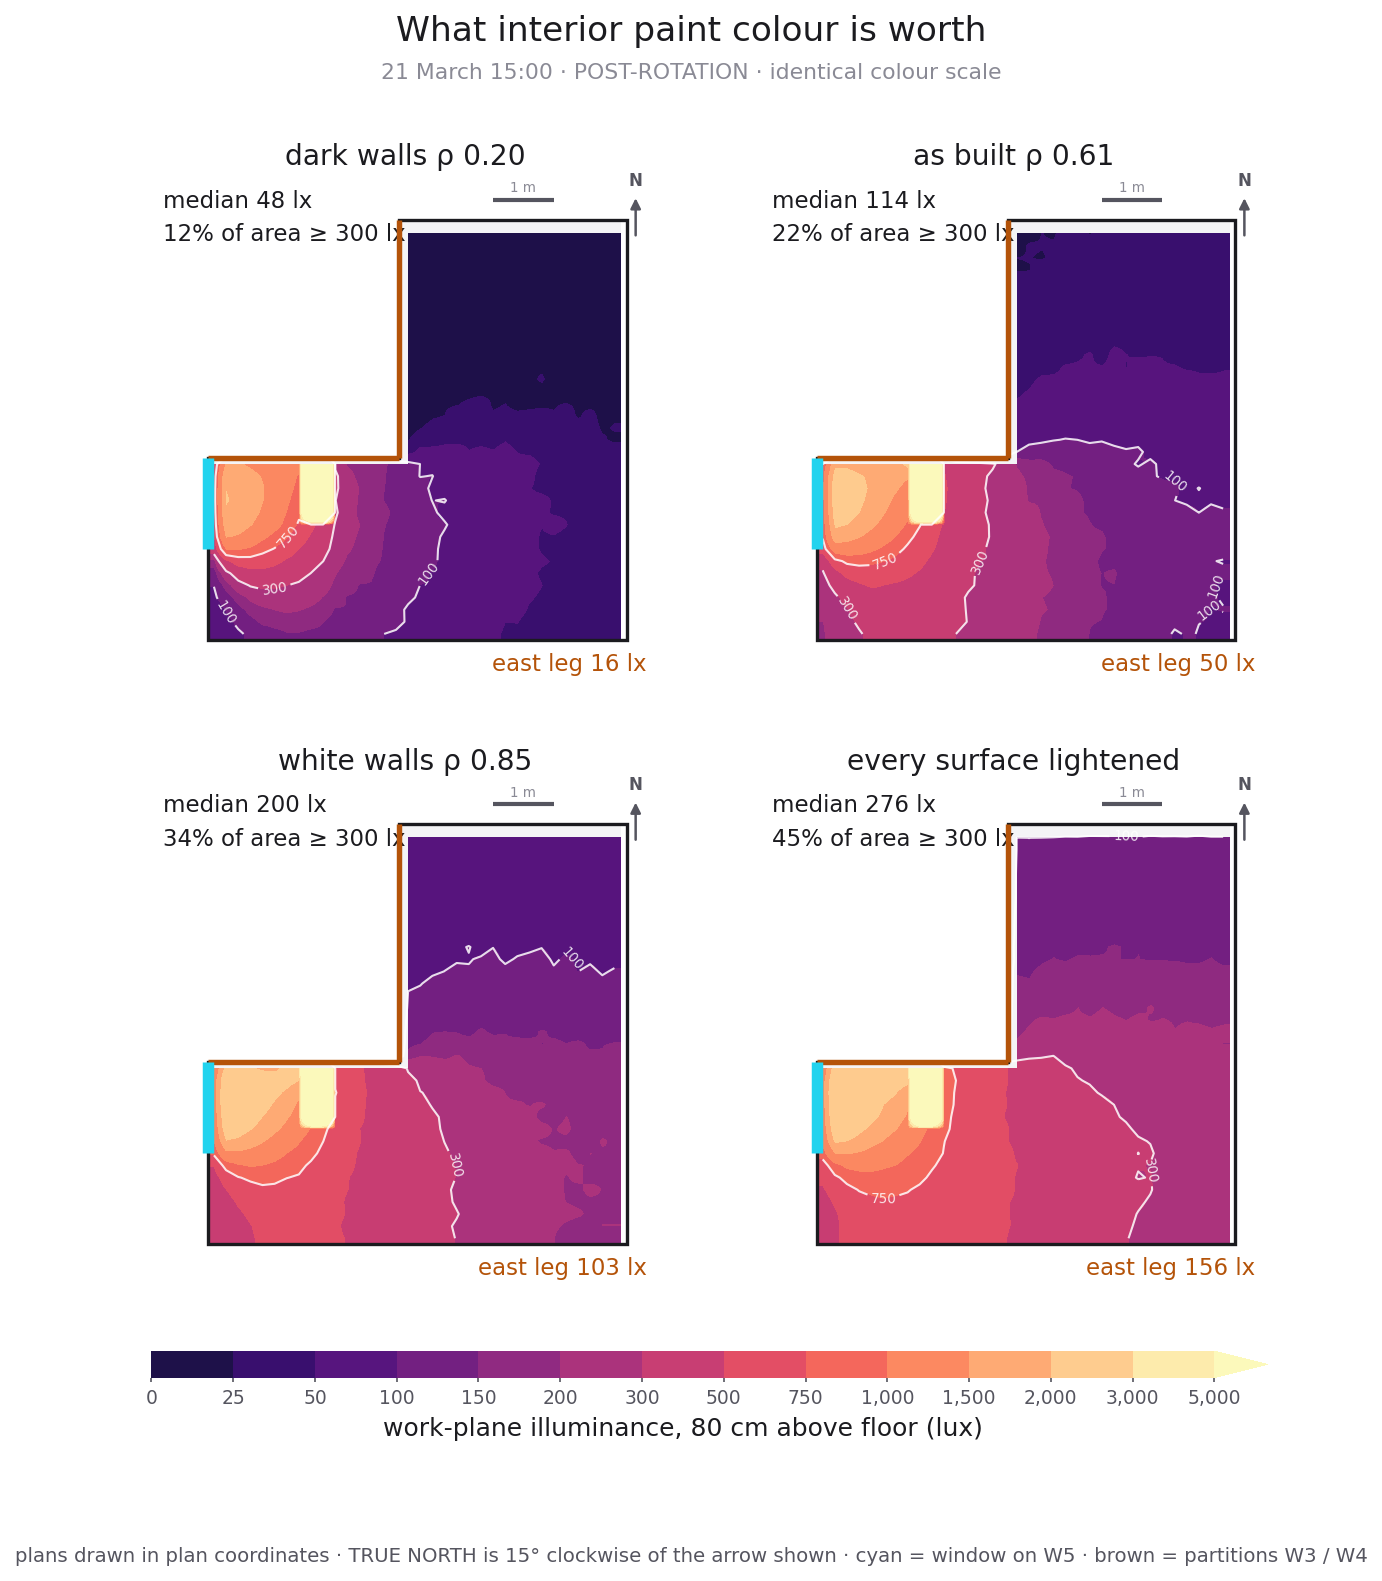
Four geometrically identical rooms differing only in surface reflectance. Median illuminance 48 → 114 → 200 → 276 lux; east leg 16 → 50 → 103 → 156. The bottom-right panel nearly triples the dark corner for the price of paint.
The top-left panel deserves a look too: dark walls at ρ 0.20 would take this room to a median of 48 lux. That is not hypothetical — it is roughly what a fashionable dark interior scheme does to a space with these constraints.
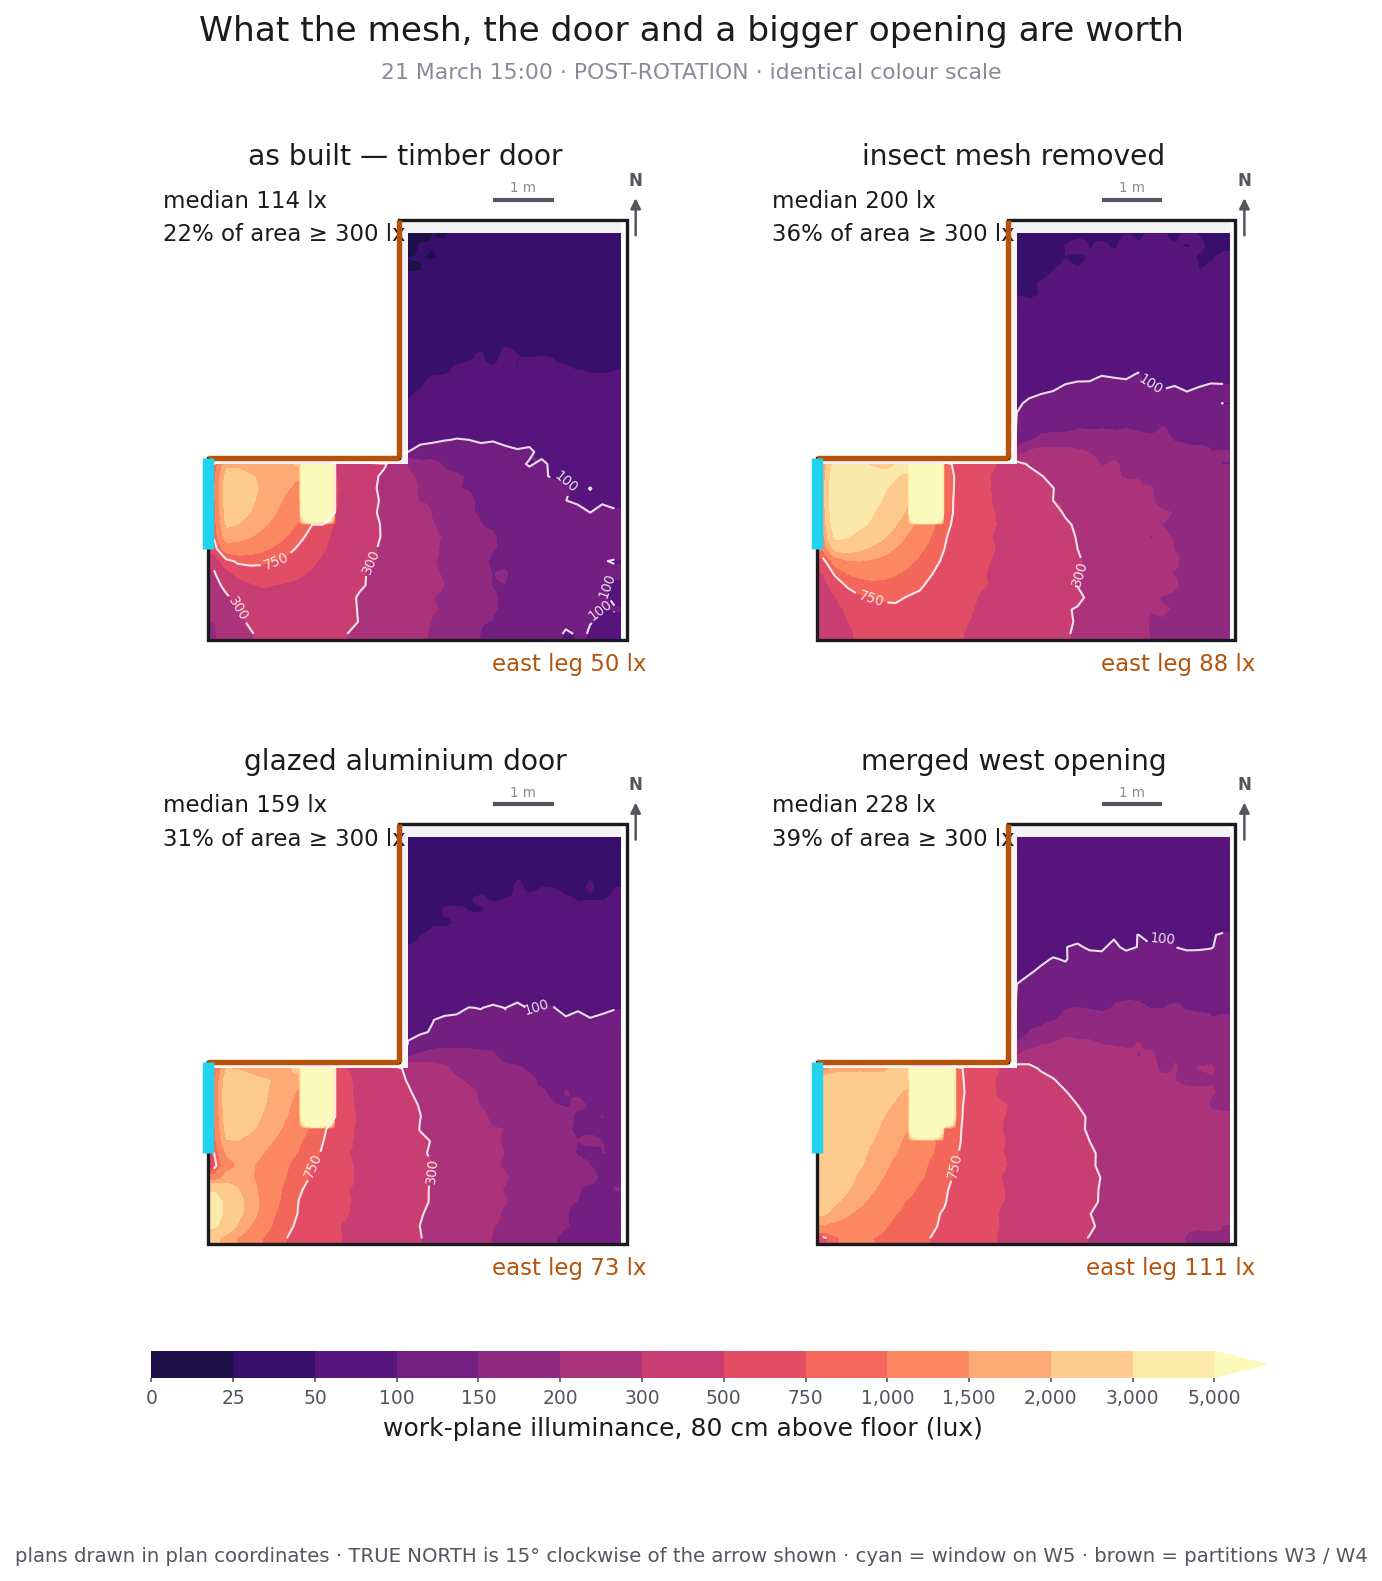
Three things share that three-metre wall. The standard fibreglass insect mesh costs 44% of the light through it — the largest single loss in the room, and a consumable you can swap in an afternoon. The timber balcony door is the second-largest area of W5 and contributes nothing; glazing it takes the median from 114 to 159 lux. The merged opening, which needs demolition and a lintel, reaches 228. Two of those three cost almost nothing.
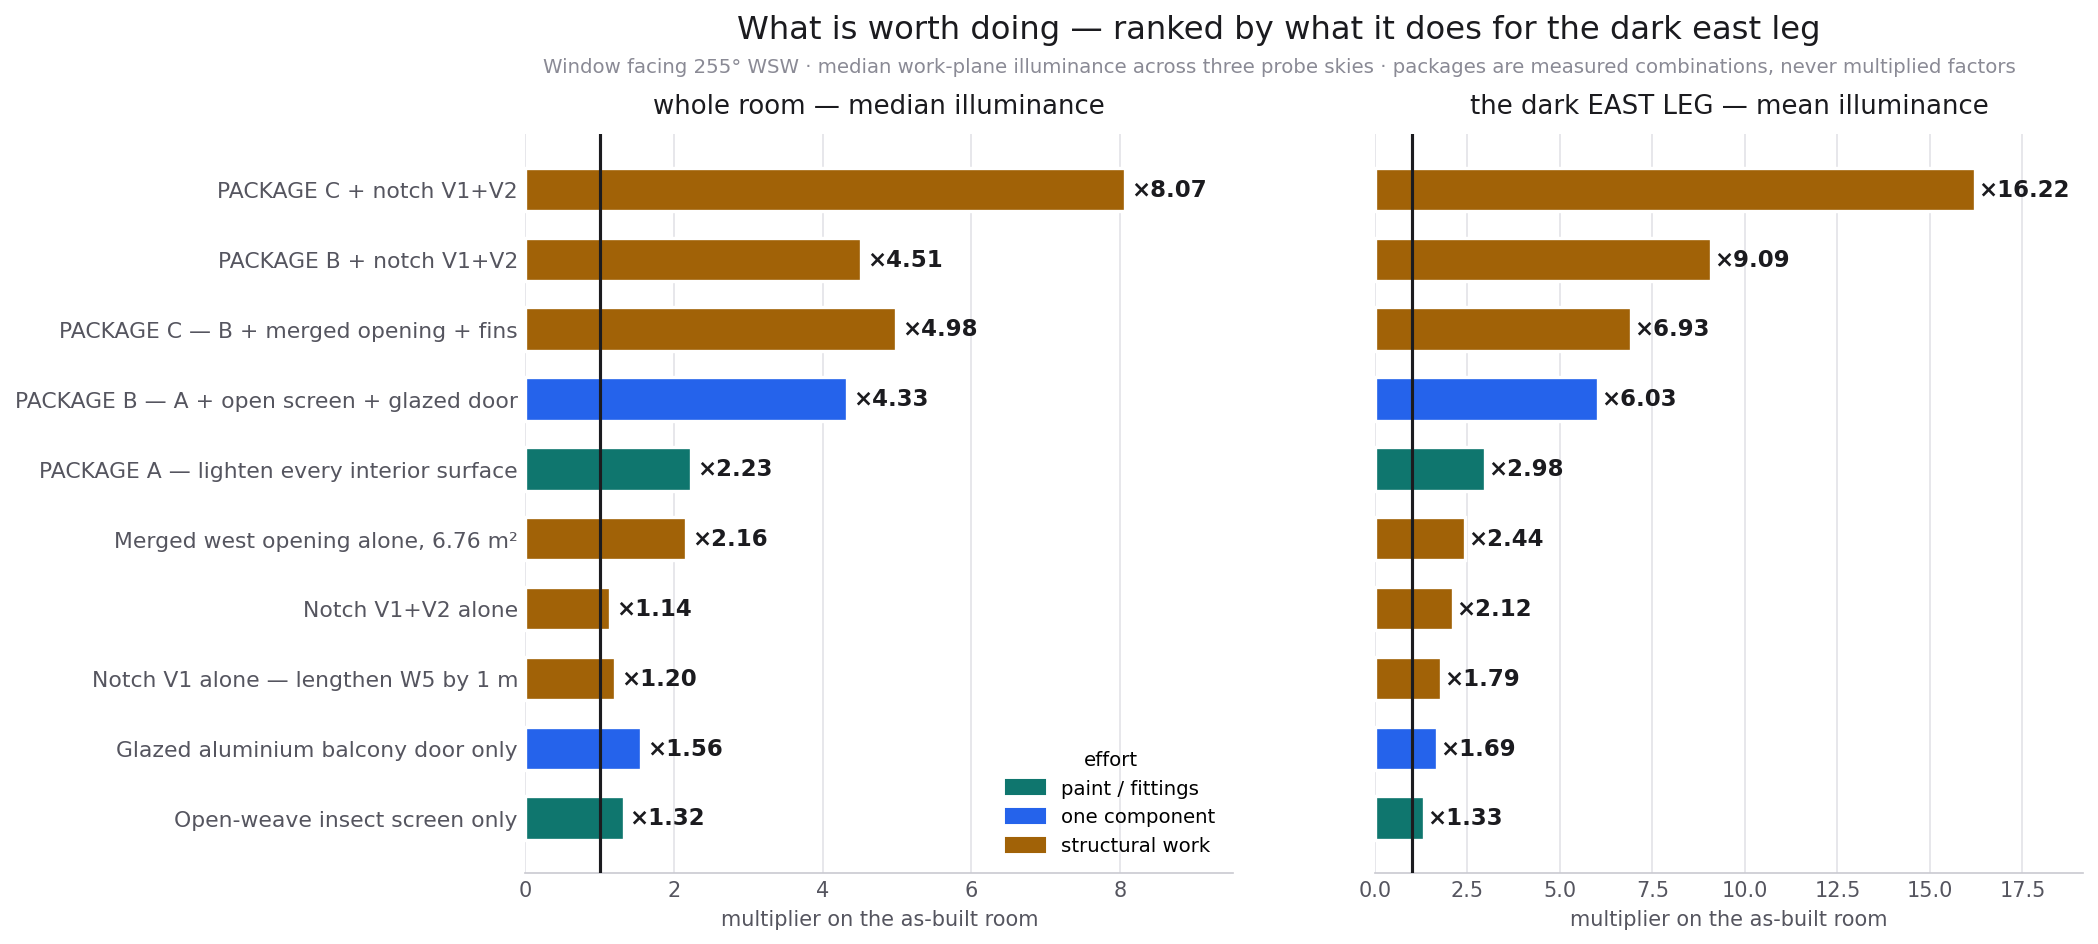
The leaderboard is the chart I would put in front of a client first, because the colour carries an argument the numbers don’t: the two highest bars are brown, but the fourth is blue and gets most of the way there.
| package | contents | room | east leg |
|---|---|---|---|
| A | lighten every interior surface | ×2.23 | ×2.98 |
| B | A + open-weave screen + glazed balcony door | ×4.33 | ×6.03 |
| C | B + merged 6.76 m² opening + fins | ×4.98 | ×6.93 |
| C + V1 + V2 | C plus both partition moves | ×8.07 | ×16.22 |
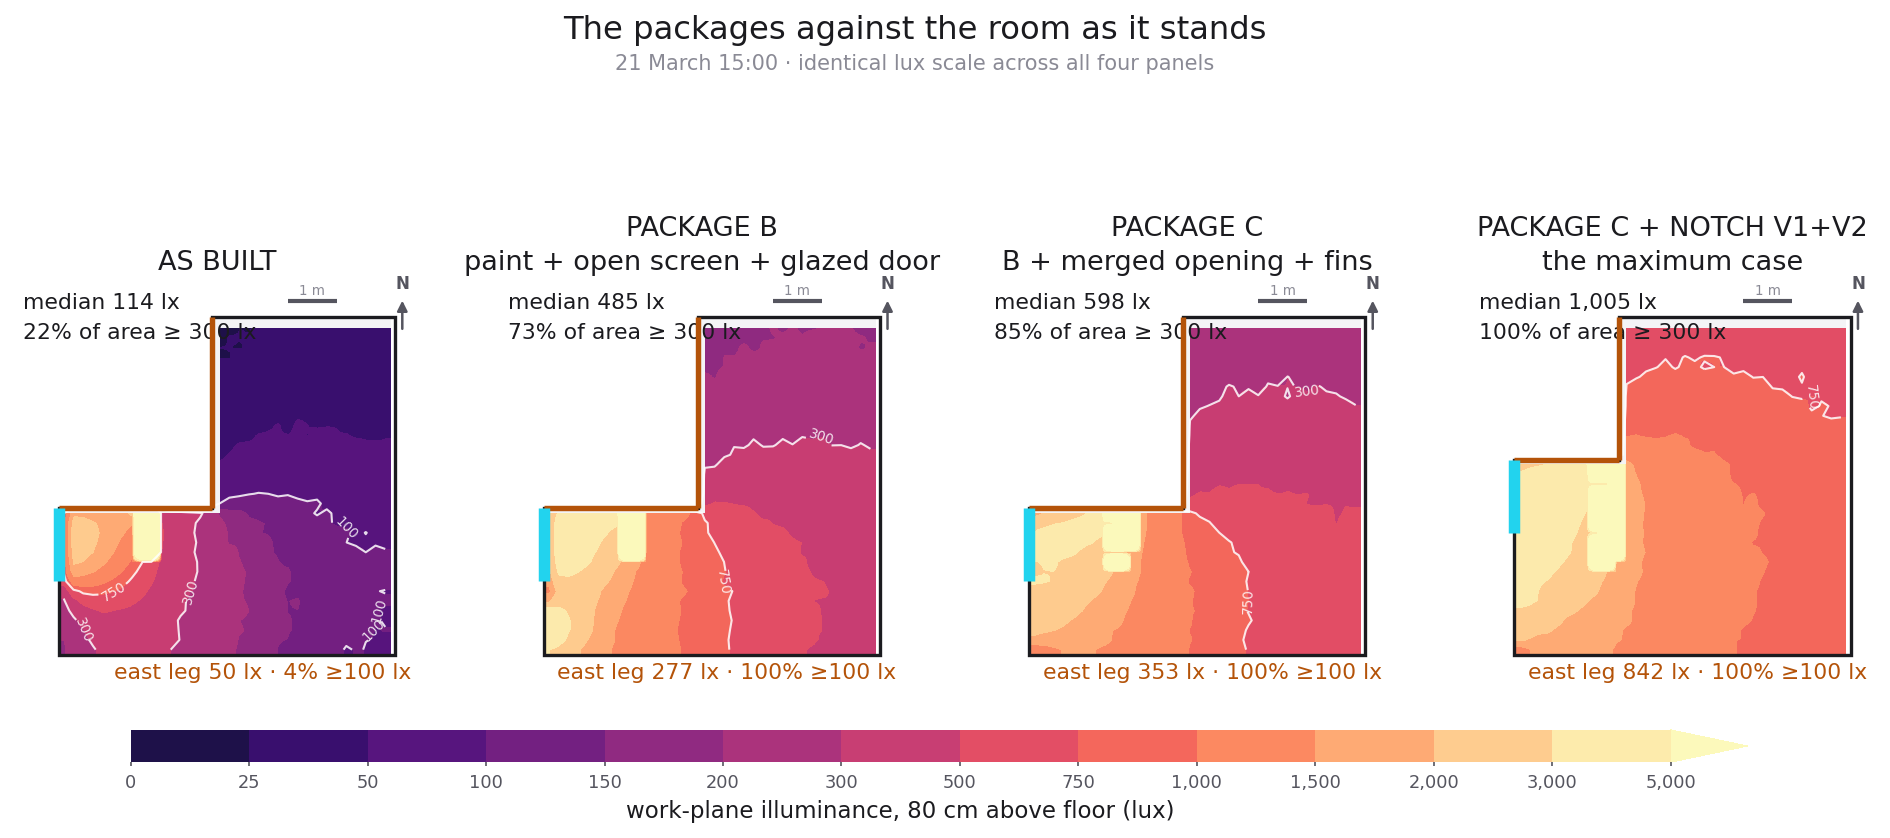
Multipliers do not multiply. Every package was simulated as a single model rather than assembled from parts. Multiplying Package B’s three interventions predicts ×4.59; the measured package is ×4.33. Daylight interventions are sub-additive, and the model refused to report the convenient product.
It reversed itself, twice, in the middle of the work
This is the part I find most worth reporting, and the part I’d have been most tempted to delete if I were selling something.
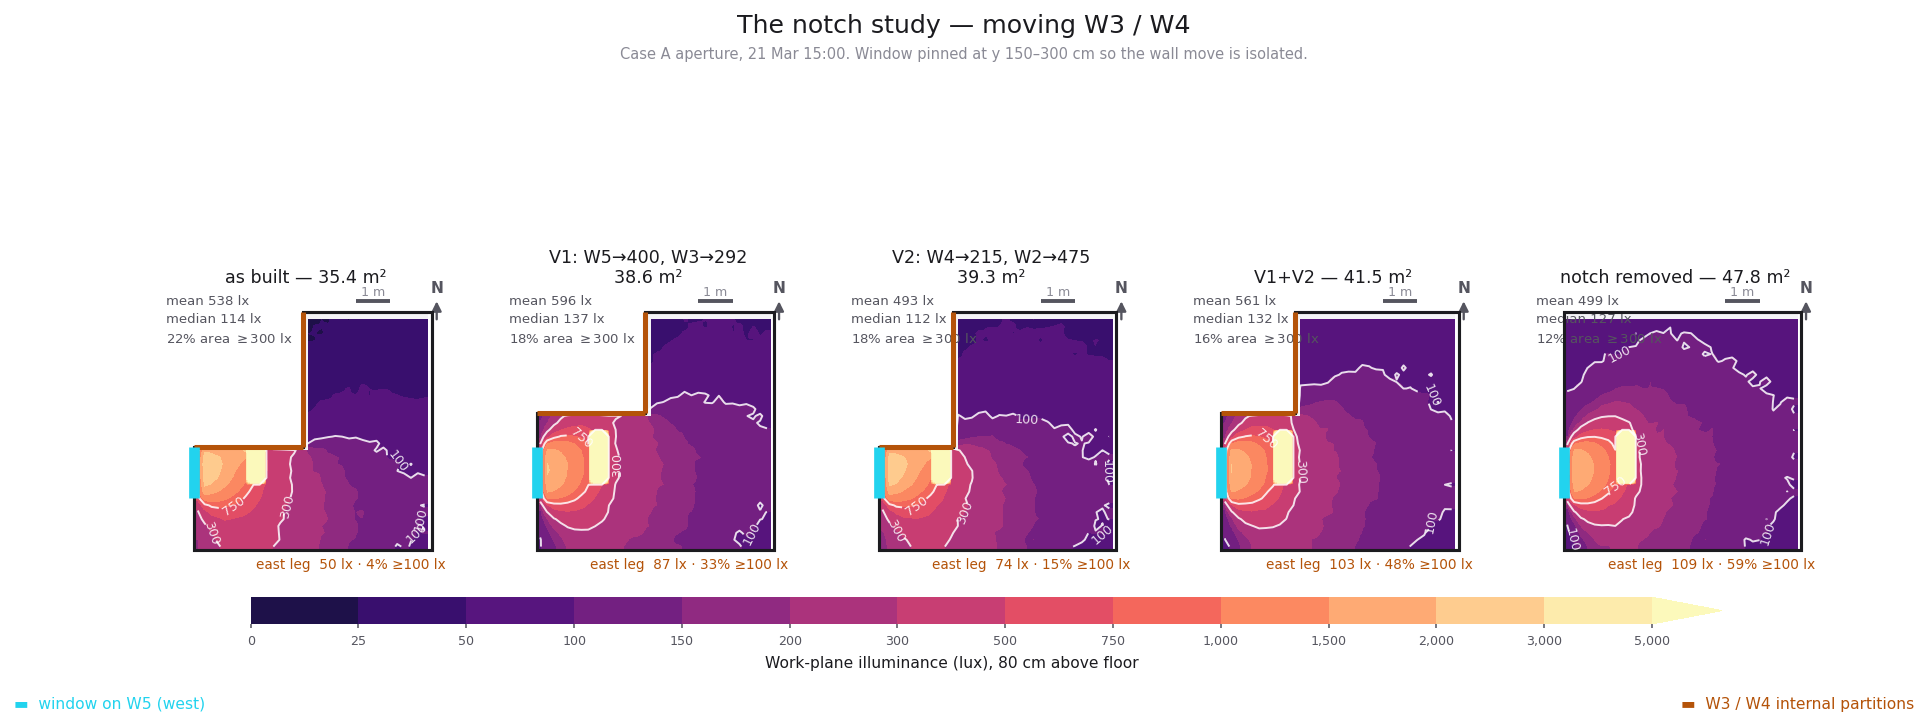
On the partitions. Tested against the bare as-built room, moving W3 and W4 looks like a poor deal — V1 lifts the median from 114 to 137 lux, and V2 on its own makes the room worse (112 lx) because it adds floor area where there is no light. It told me not to bother. Then, testing the same move combined with a package, it reversed: Package C with both partition moves reaches 0.790% east-leg daylight factor against Package C alone at 0.342%, a factor of 2.3. It went back and rewrote the recommendation, and labelled the section “a verdict I reversed”. Its own summary of the lesson: provisional advice given on a single test is not advice, it is a first draft.
On morning versus afternoon. It told me — and I relayed onward — that the room is brighter in the morning than the afternoon. That was wrong. It came from an early geometry in which the block opposite was assumed nine metres tall. When the height was confirmed at five storeys the result inverted, and the conclusion wasn’t revised when the numbers were. What survives is the mechanism, stated properly: normalised by available daylight, the room delivers 3.7 lux per klux of exterior illuminance at 09:00 against 2.4 at noon — about 1.5× more efficient in the morning, because the sunlit wall opposite works as a large beige reflector. But higher efficiency on a smaller supply doesn’t beat direct afternoon sun. More efficient in the morning, absolutely brighter in the afternoon. Both true; only one useful.
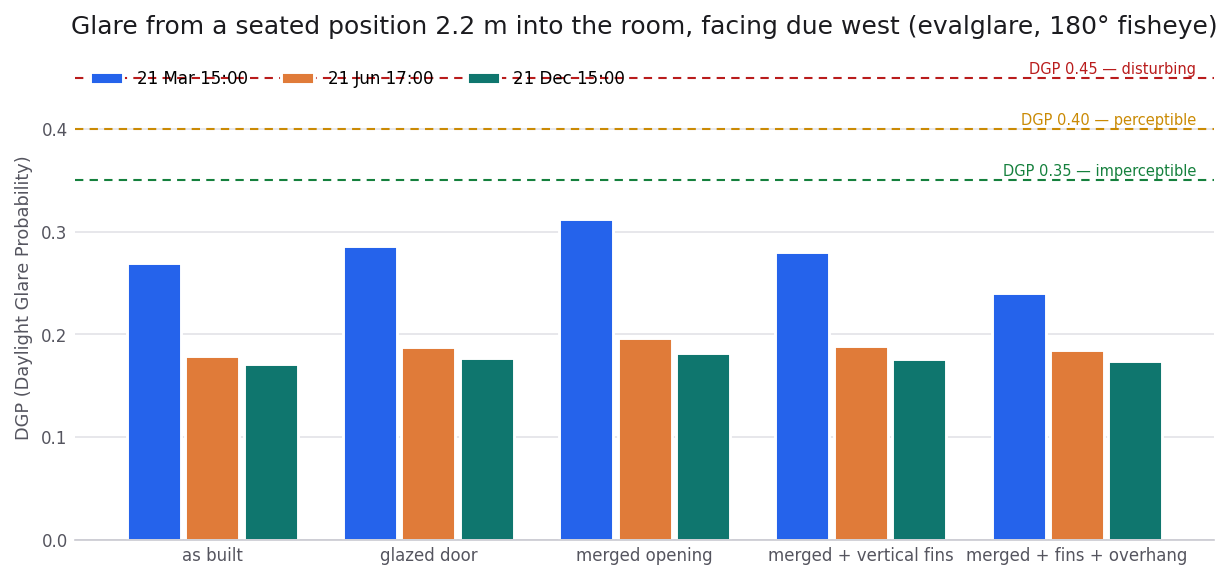
And on glare — a third reversal, arguably. It declared glare a non-issue on the strength of that chart. Then it ran a worst-case probe from a seated position 1.2 m from the window and got DGP 1.000, with 31 154 lux at the eye. That is the sun’s disc directly in the field of view. Its own note: “Glare was declared imperceptible on the strength of one eye position.”
The room’s brightest hour is also its most uncomfortable hour. Operable internal shading isn’t a refinement here, it’s a requirement.
Where it failed
Three failures, stated plainly, because a post like this is worthless without them.
It was never validated against a measurement. Every check in that validation table is internal — the model verifying itself against physics it also implemented, and against gensky, and against the weather file’s own irradiation totals. Those are real checks and they caught real errors. But nobody has walked into that room with a lux meter. Until somebody does, this is a very carefully self-consistent model of a room, not a measurement of one. That distinction does not go away because the internal checks were thorough.
Its watchdog reported a stalled run as healthy — twice. The process that was supposed to notice a hung simulation was running in the same shell as the simulation, so when the shell wedged, the watchdog wedged with it and kept reporting green. A monitor that shares a failure mode with the thing it monitors is not a monitor. This is an old lesson from systems engineering and it arrived here fresh, which tells you something about how much of the operational discipline around these tools still has to be built.
It found nine of its own bugs — which means it wrote nine bugs. A mirrored solar azimuth function computing east-facing access instead of west. A north wall generated at constant x instead of constant y, leaving the room open to the sky and reading 3 639 lx in a corner where 319 was correct. A direct-sun coefficient matrix returning all zeros because sky_glow has maxrad 0 and is invisible to Radiance’s direct calculation at -ab 0. Solar gain computed against the visible sky matrix instead of the total-solar one, reading 40% low. Every one was caught by a check rather than by inspection — and every one would otherwise have produced a plausible-looking report with a wrong number in it.
That last point cuts both ways, and I don’t think the direction is obvious. The errors are alarming. The fact that a purpose-built check caught each one is more reassuring than the absence of errors would have been, because the absence of errors is usually a claim about a codebase nobody has stress-tested.
So what actually changed
Here is where I’ll hold an opinion.
What did not change: the physics, or the standard of evidence. The Radiance parameters are the same parameters. The IES LM-83 occupied period is the same period. Nothing here is a new method, and nothing about a study being generated quickly makes it more likely to be right.
What changed is the cost of thoroughness. 64 variants is not 64 variants because someone was diligent; it is 64 variants because the marginal cost of the 40th was near zero. In practice, this is the part that matters most. The expensive move in consulting daylight work has always been asking one more question — testing the assumption you’d normally note as a limitation and move past. The parapet you assumed absent. The neighbour’s paint colour. Whether the ranking metric you picked is doing something silly. Every one of those got tested here, and several of them changed the answer. That’s not speed for its own sake. It’s the difference between a study that has a limitations section and a study that shortened its limitations section by going and checking.
What it does not replace is the person who owns the question. Look again at that input table — it is short, but every line of it is a fact about the world that had to come from someone standing in the room. Which walls have neighbours behind them. That the door is timber and not glazed. That the block opposite is blank. Get any of those wrong and every downstream number is confidently, thoroughly wrong. The model was rigorous about propagating what I gave it and completely dependent on my having given it correctly. It said as much itself, in the section on the parapet: assumed absent, flagged as the single assumption most worth confirming, and left for me to go and look at.
That is, I think, the actual shape of it: the scarce input is no longer analytical labour, it’s ground truth and judgement about what matters. I’ve argued elsewhere on this blog that a human reading a dashboard is a real actuator in a digital twin loop — that it shouldn’t matter whether the thing that acts on information is a machine or a person. This is the same argument from the other side. The loop here ran almost entirely inside the model, and the human contribution collapsed down to two things: supplying the facts, and deciding whether the answer was worth believing. Both are small in volume. Neither is small in consequence.
And it doesn’t replace the ceiling. Which brings me to what I think is genuinely the best output of the study, and it’s a negative result.
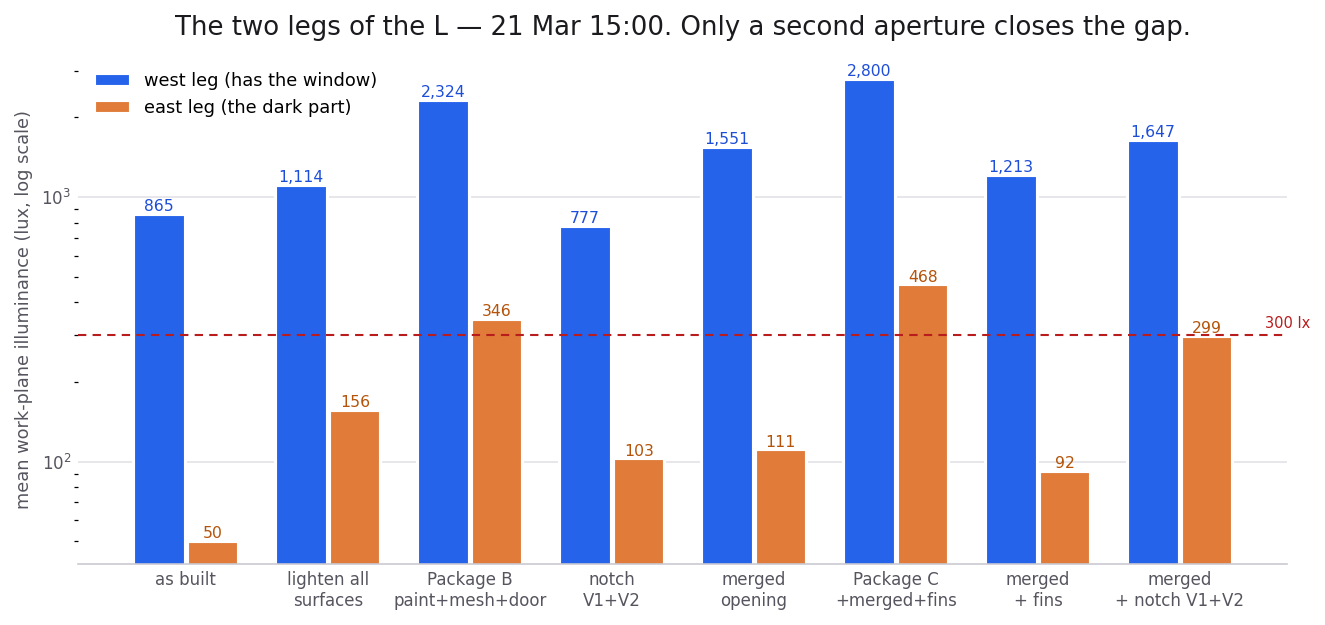
The log scale is doing something important: it lets a room reading 2 800 lux share an axis with a corner reading 50, so the gap between each pair — not either bar’s height — is what you notice. That gap barely narrows. As built the two legs differ by a factor of 17; under Package C, by a factor of 6. Better, and still a different room.
Even with everything stacked, the east leg reaches about 0.79% daylight factor against a 2% threshold. Not a shortfall of effort — a structural consequence. That zone has no line of sight to the only aperture the room possesses. A second window would have changed the answer, and a south opening would have looked straight up the length of the dark leg; all three candidate walls turned out to be interior. The move that would have worked is foreclosed by the plan.
So the recommendation ends with two sentences that have nothing to do with simulation at all: put the desk in the west leg, and design proper electric lighting for the east leg from the outset, because good dimmable high-CRI fixtures will serve better than any amount of white paint pretending the daylight problem has been solved.
A model that can generate 64 variants overnight and then tell you the honest answer is don’t spend the money, buy a lamp is more useful to me than one that can’t. The temptation in this whole area is to demonstrate capability. The thing worth wanting is a collaborator that will tell you when the capability doesn’t help.
I don’t think the interesting question is whether this replaces the analyst. I think it’s what an analyst does with the twenty questions they previously couldn’t afford to ask — and whether, having got the answers, anyone goes to the room with a lux meter and checks.
The study: Radiance 6.0.2, TMYx weather from climate.onebuilding.org, 64 variants, analysis and figures in Python. All of it, including this list, generated rather than written by hand. The room is real and the lux meter reading is still outstanding.